Revamping the Website Experience: Decreasing Bounce Rate with a Redesign
Mission successful! as the bounce rate has come down to 30% from 52%
Timeline:
4 Weeks
Role:
Product Strategy, Competitive analysis, user journey, information architecture and Visual design
Solo
IMPACT

Bounce Rate
A 22% drop in bounce rate was resulted in the test phase

Direct Sales
A 26% rise in direct sales of reports was observed through website

Sale conversion rate
This is the highest rate the website has recorded!

ABOUT THE CLIENT
DataM Intelligence started working with clients on customized marketing reports and providing market intelligence insights pulling ahead of their competitors.
CLIENTS MAIN GOAL
IMPROVE THE DIRECT PURCHASES THROUGH WEBSITE
CURRENT PURCHASE FLOW

CHALLENGE
HOW MIGHT WE HELP DATA-M REDUCE THE BOUNCE RATE AND INCREASE DIRECT SALES
RESEARCH METHODOLOGY

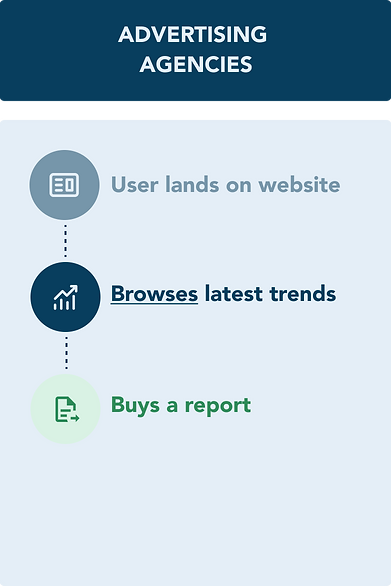
WHO NEEDS MARKETING REPORTS?
Analyzed the user journey of 2 crucial personas

Key Step
Key Step
Key-steps from the above user flow were ignored by the current interface, leading to higher bounce rate
MY DESIGN STRATEGY

Note down key steps from each persona

Ideate features on website to help that specific persona
KEY STEP 1
Advertising agencies browse reports from latest trends and make a purchase
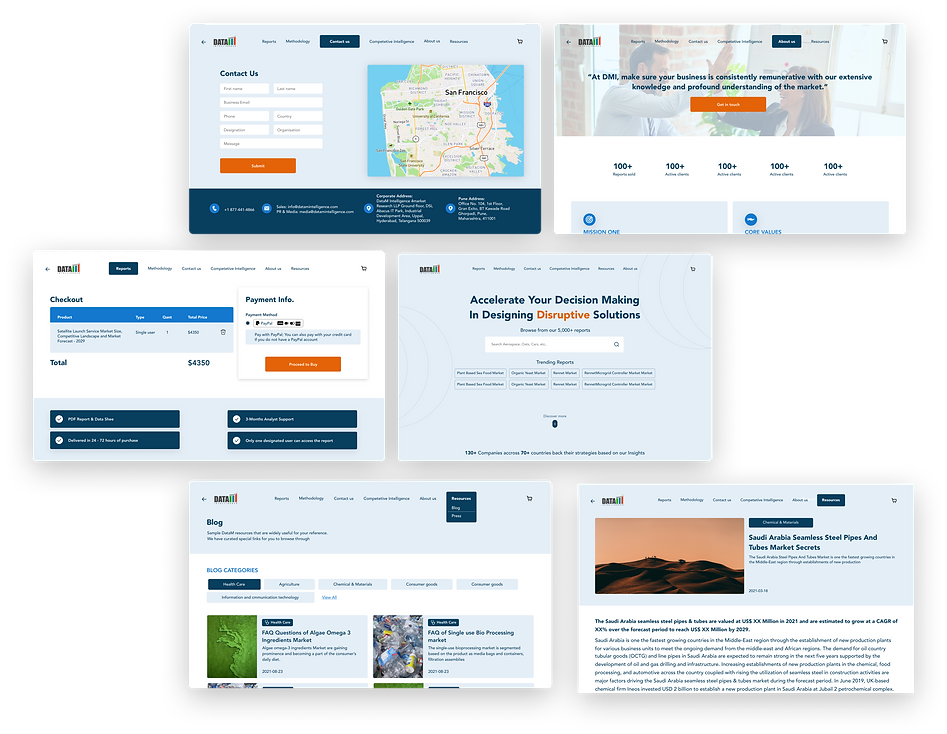
OLD HERO SECTION

NEW HERO SECTION
Fresh look with better hierarchy and visual composition to discover with ease

NUDGING THE USER WITH EXPLORATIVE TOP REPORTS SECTION IN RELEVANT PAGES ON WEBSITE

KEY STEP 2
Market research firms browse reports through specific industry verticals
OLD REPORTS PAGE

NEW REPORTS PAGE WITH IMPROVED INDUSTRIES DISCOVERABILITY
Made clear categories followed by a relative icon to fasten discoverability. Better discoverability leads to better sales as customers easily find what they NEED
Made clear industry categories for better browsing

KEY STEP 3
Market research firms browse for very specific reports as they perform niche studies
OLD INTERFACE

NEW INTERFACE WITH SUBCATEGORIES AND FILTERS FOR BETTER DISCOVERABILITY
New section to improve report discoverability

KEY STEP 4
Safe and efficient checkout portal for customers to checkout with confidence.
OLD INTERFACE

NEW INTERFACE WITH STRUCTURED INFORMATION
Displaying deliverables will make user comfortable in checking out

KEY SCREEN
Reports screen is one of the key screens where all the information of the report is visualized. This is where buying flow starts
OLD INTERFACE

NEW INTERFACE WITH ORGANIZED CTA'S AND REPORT NAVIGATION

OTHER KEY SCREENS WHICH WERE RE-DESIGNED
LEARNINGS
Building a Strong Foundation in Marketing Domain Knowledge for Better user empathy
Learn’t navigating the Challenges and Rewards of Independent Design Work

Empathy Matters
learn’t navigating through the Fast-Paced World of Agile Design
Understanding the Vital Role of Empathy in Design and Life

UI
Matters
Understanding the Vital Role of User Interface in Design and User Experience
Learn’t the Importance of user journey for the best UX

Diving Deep into Marketing

Going
Solo

Sprint environment

Efficient Journeys, Efficient websites